top of page
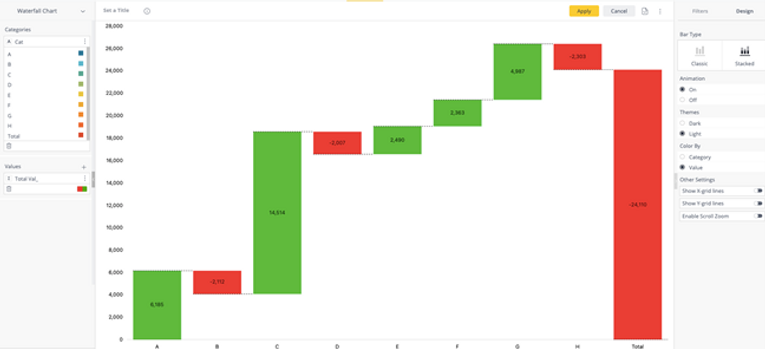
The columns can be colored either by conditional formatting as above, or by category.
Also, the columns can be stacked by another dimension to see each income or expense in higher detail:

bottom of page
The columns can be colored either by conditional formatting as above, or by category.
Also, the columns can be stacked by another dimension to see each income or expense in higher detail: